
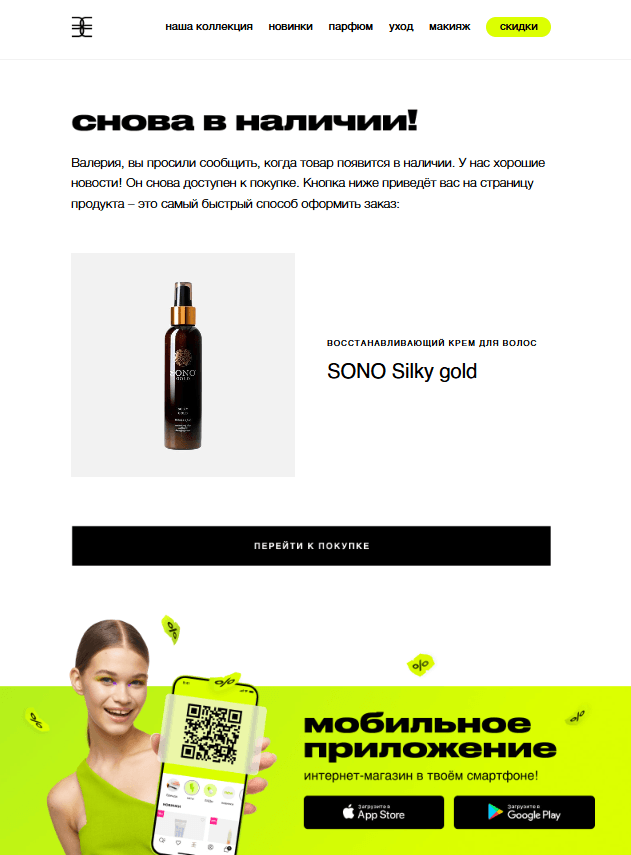
A name in the greeting and products from your last purchase category — that’s the basic level of personalization. Today, this approach no longer makes an email stand out among dozens of others in the inbox.
Behavioral data lets you go much further. With it, you can factor in exactly what a person looked at on the site, which elements they clicked, what time they usually check email, and how they react to different types of content.
What counts as behavioral data
Behavioral data is a history of actions taken by a user, not static information they filled in at sign-up.
- Views: which products and pages on the site the user looked at.
- Clicks: which links and banners they clicked inside emails.
- Activity time: which hours and days of the week they usually open their email.
- Abandoned actions: adding a product to the cart or browsing a category without following through with a purchase.
- Activity history: how often they visit the site and how regularly they buy.
- Response to formats: how the user interacts with different types of content (promo codes, useful articles, digests).
What’s the difference? Profile data (age, city, gender) is static and filled in once. Behavioral data updates in real time with every action and reflects a person’s current interest far more accurately.
Why standard segmentation falls short of behavioral segmentation
Standard segmentation (by gender or age) splits the list into groups that are too broad. Within them, people’s behavior can vary drastically. Two subscribers of the same age from the same city might react to emails in completely different ways: one only clicks on discounts and sales, while the other ignores promos but reads expert reviews closely.
Behavioral segmentation splits the audience not by who a person is, but by what they’re doing right now. This lets you build precise, dynamic groups for email campaigns even when you have no demographic data on a subscriber at all.
🔗 More on customer segmentation: methods and a step-by-step guide
Sources of behavioral data: where to get signals
Signal | Where it’s collected | What it tells the marketer |
|---|---|---|
Email clicks | ESP / Letteros | Which blocks, products, and content categories are of interest |
Opens by time | ESP / Letteros | What hours a specific person is most active |
Site views | Web analytics, UTM tags | What exactly the user looked at after clicking through from an email |
Purchases and their frequency | CRM / CDP | Repeat purchase cycle and average order value |
Cart abandonment | CRM / store platform | A product that generated strong intent but the purchase wasn’t completed |
For a basic level of personalization, linking ESP and web analytics data is enough. To build a precise, automated system, you need CRM or CDP integration — then purchase and on-site behavior data will flow into emails automatically.
🔗 Guide: how to connect CRM, CDP, and ESP to Letteros
How to apply behavioral signals in email marketing
- The “Browse Abandonment” trigger. The user looked at a specific product but didn’t add it to the cart. A personalized reminder email featuring that product 24 hours later works far better than a generic standard selection.
- Dynamic selection based on clicks. If a subscriber regularly clicks on products from the “Shoes” category, the next regular email should automatically lead with that block.
- Send-time optimization. Instead of going out on a single schedule for the whole list, the email is sent at the hour a specific recipient most often checks their inbox.
- Content balancing. If analytics show a user ignores promotional emails but opens useful articles, the system automatically reduces the share of sales content in their feed, replacing it with a helpful digest.

Click maps as a behavior analysis tool
A click map clearly shows which elements of an email the audience responds to most: the main banner, a text link, a CTA button, or a specific product in a selection. It helps assess not just recipients’ interests, but the usability of the template itself.
🔗 What a click map shows and how to interpret it

A heatmap clearly shows which content actually grabs attention, saving the marketer from guesswork at the design stage.
5 common mistakes when working with behavioral data
- Relying only on purchase history. Ignoring intermediate actions (views and clicks) narrows your options for communication.
- Collecting data for its own sake. Piling up terabytes of information in the CRM that never gets used to set up real triggers or segments.
- Overreacting to every action. Sending a full email for every minor click is a bad idea. One random product view shouldn’t flood the user’s inbox.
- Rarely updating segments. Customer behavior and interests change faster than rigid static segmentation rules can keep up with. Segments need to be dynamic.
- Being overly blunt. Phrases like “We saw you looking at this product 5 minutes ago” often make users uncomfortable and feel watched. Be more subtle.
Checklist: what to check before launch
- System integration is set up: data flows seamlessly between the ESP, web analytics, and CRM.
- Automation is working: data updates in real time without manual exports.
- Segments are dynamic: users are automatically added to and removed from lists as their behavior changes.
- Templates are adapted: your regular newsletter includes at least one dynamic block that adapts to the recipient’s interests.
- Limits are configured: trigger send frequency is strictly capped so as not to overload subscribers.
Bottom line
Behavioral data is more objective than profile data — it reflects a customer’s real, current interest here and now. Views, clicks, activity time, and format response give you a ready-made foundation for emails that arrive at the right time and hit the mark.
You can start small — set up tracking of basic actions in your ESP and web analytics, gradually adding CRM/CDP capabilities as your list grows and scenarios get more complex.
- What email personalization is and how to use it
- How to personalize emails to boost conversion
- Customer segmentation: what it is, methods, and a step-by-step guide
- What a click map shows and how to interpret it in marketing
- How to properly connect CRM, CDP, and ESP to the Letteros platform
🚀 Want to automate your work with behavioral data and boost email ROI?